Last night after the close Noodles (NASDAQ: NDLS) reported a weak 3rd Quarter sending the stock down at the open this morning 5%. Equities Research Summer Newsletter Short Picks are all down significantly over the 4 months since the picks were made, while the Standard and Poors 500 Index remains flat. Under Armour Reported 3rd Quarter Financials last week sending stock down $7 for the week. Next up will be Titan Machinery reporting 3rd Quarter financials either the last week of November or early December. Unlike Noodles and Under Armour, which are just over valued stocks with weakening fundamentals, Titan Machinery may find themselves out of business soon unless they are able to raise capital. Warning on Titan Machinery
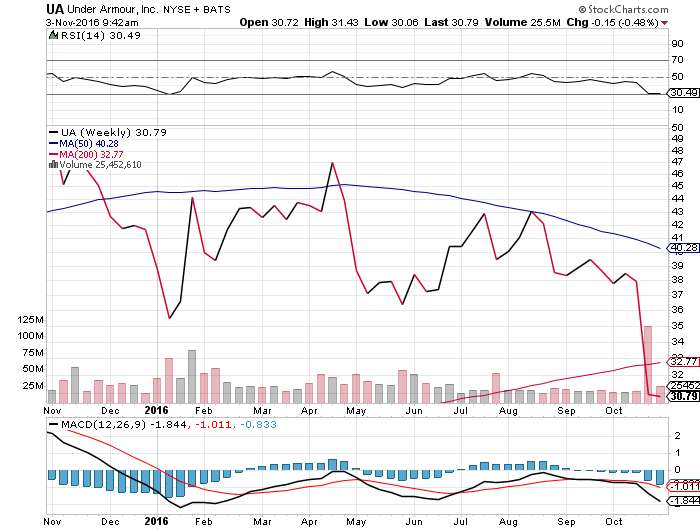
Under Armour (NYSE: UA $30.79) closed yesterday down 36% since closing @ $48.20 (adjusted for split) on November 2,2015. Over the Same 1 year period the S&P500 Index which closed yesterday @ 2097 is down a mere 7 points from November 2,2015 close @ 2097 (is flat.) The company filed their 3rd quarter 10Q with the Securities and Exchange Commission yesterday. Highlights from 10Q
DEBT INCREASES to Over $1 Billion
Related Party Transactions : CEO Kevin Plank entity Sagamore Development Holdings sold property for $70.3 million to Under Armour. According this news story the sale price was more than twice what Plank paid for the property in 2014.
Allowance for Doubtful Accounts
As of 9/30/16 $33.6 million, 12/31/15 $5.9 million 9/30/15 $6.3 million.
Company Improved EPS growth due to lower Q3 2016 (32.6%) tax rate vs Q3 2015 (38.8%)
Company enjoys higher gross profit margins because they record shipping and handling fees as net revenue but expense the cost as selling and general administrative expenses vs cost of revenue. The $25.7 million in Q3 charged in SG&A helped gross profit increase from 45.7% to 47.5%.
Company Recorded more than $65 Million of Net Revenue from shipping and handling fees for the first 9 months of 2016 up from $40 million attributed to net sales in first nine months of 2015
Under Armour (NYSE: UA) will report 3rd quarter financials on Tuesday and Wall Street continues to be Bullish. Equities Research continues to Warn Investors to stay away from this high flyer and focus on the weak fundamentals and not the Hype!
At end of day the rising debt, high interest expenses and declining operational cash flow will be reflected into a lower stock price.
On May 6, 1991 the Dow Jones Industrial Index added The Walt Disney Company (DIS) , Caterpillar (CAT) and J.P. Morgan. May 6,1991 vs February 9,2016 DJIA 2,941.64 16,014 444% 7.1% annually DIS $7.77 $92.32 1088% 10.5% annually CAT $3.50 $63.93 1726% 12.4% annually JPM $3.06 $56.20 1736% 12.5% annually 10 Year Return February 9,2006 DJIA 10,883 16,014 47% 3.9% annually DIS $22.70 $92.32 306% 15.1% annually Since Stockdiagnostics Upgrade February 14,2005 , Disney has gained 269% (12.6% annual) in 11 years vs a 50% (3.8% annual)gain for the Dow Jones Industrial Average over the same time frame. click to DIS Stockdiagnostics OPS chart click to DIS GFNN news story
"Stocklemon believes that StockDiagnostics.com is one of the best stock advisory sites on the web. It judges companies based on a proprietary OPS rating and covers both long and short positions."---------September 22,2003 Andrew Left founder of Citron Research
"From time to time I'm asked about analysts, diggers whose work I really respect, who do things well. Tom Renna, @GFNNstock, is a must follow— Roddy Boyd (@BoydRoddy) September 7, 2013
Feb. 5,2015 -- Under Armour CEO Kevin Plank talks about why he's buying the MyFitnessPal and Endomondo apps for a total of about $560 million. Equities Research Looks at Under Armour *Negative Cash Flow (~goodwill $472 million)
On Thursday morning Under Armour (NYSE: UA) reported FY2015 earnings sending the stock $20 higher from $65.58 to close the week @ $85.43. Up 30% in two days.
Record Sales and earnings were super impressive, but a close look at the cash flow statement raises a RED FLAG. note: As of Sunday (1/31/16) Under Armour has not yet filed their 10K annual report with the Securities and Exchange Commission as of this morning so we are not able to dig deep into footnotes and other exhibits at this time.
A look at the 8K filed on Thursday can be found here.
Before I jump to the FY2015 Negative $44 Million Operational Cash Flow, lets look at 2 recent SEC filings that should make investors wonder how many total shares are really outstanding when including Class A, Class B and Class C shares.
Shares Fall 8.5% in 1 day
On November 12,2015 Under Armour traded at $94.16 with volume of 3 million shares.
On November 13,2015 Under Armour traded at $86.08 with volume of 7 million shares.
What happened?
At 10am November 12th CEO Kevin Plank filed this SC 13D/A with the Securities and Exchange Commission.
"(Kevin Plank)entered into a pre-arranged stock trading plan to sell shares of the Issuer’s Class B Common Stock and, if and when issued, the Issuer’s Class C Common Stock."
"If the Reporting Person completes all the planned sales under this trading plan, he would beneficially own 35,700,000 shares of Class B Common Stock and Class A Common Stock, representing approximately 16.6% of the total shares of Class A and Class B Common Stock outstanding as of September 30, 2015 and representing approximately 66.5% of the combined voting power of the Issuer outstanding as of September 30, 2015".
Consolidated Class Action Lawsuit
August 14,2015 this DEFA 14A filing with the Securities and Exchange Commission was filed.
"Under Armour ..is currently involved in a consolidated class action lawsuit brought against the Company and the members of the Company’s Board of Directors on behalf of purported stockholders of the Company in connection with the creation by the Company of a new class of common stock, referred to as the Class C common stock, par value $0.0003 1/3 per share"
Are You Still Long? Operational Cash Flow for FY2015 was NEGATIVE $44 Million! vs Operational Cash Flow FY2014 of Positive $219 Million.
Year over Year Operational Cash Flow declined by $263 Million
Operational Cash Flow FY2010: $50 million FY2011: $15 million Fy2012: $200million FY2013: $120 million FY2014: $219 million FY2015: NEGATIVE ($44 Million) Cash Flow used in 2 Acquisitions during 2015. $475 million for MyPalFitness.com $85 million for Endomondo $560 Million total cost, $472 million GOODWILL Under Armour Stock Price has had a History of Following Cash Flow. November 18,2005 IPO
Under Writer: Goldman Sachs. 9.5 million shares @ $13 (adj for 2 (2 for 1)splits $3.25).
Shares went from $13 to $68 on August 21,2007.
Enter Equities Research
Equities Research went bearish (A-E) on UA at $68 to $15 before going Bullish.(F)
Market Capitalization has increased by $3.3 Billion today to $19 Billion!
Shares of Under Armour are up 22% today on volume of 14 million.
The stock was down 15% year to date ($80.61 on December 31st close) as of yesterday's close @ $68.58.
As of 2pm this afternoon, the stock is up 3.6% year to date.
On September 17,2015 the stock hit an all time high of $105.89. and is off 21% over the past 4 months.
Operational Cash flow for the 4th quarter came in at $270 million up 35% compared to Operational Cash flow in the Fy2014 4th quarter of $199 million.
There is one Number that investors should be slightly concerned with though, 8k
Operational Cash Flow for FY2015 was NEGATIVE $44 Million!
vs
Operational Cash Flow FY2014 of Positive $219 Million.
Year over Year Operational Cash Flow declined by $263 Million
Operational Cash Flow
FY2010: $50 million
FY2011: $15 million
Fy2012: $200million
FY2013: $120 million
FY2014: $219 million