Monday, May 16, 2016

$100 Invested in Uber in 2010 Would Be Worth Over $1 Million By 2015

Michael Markowski | 
One hundred dollars ($100) invested into Uber’s October 2010 private placement was valued at $1,050,000 by the end of 2015. The only problem is that it was not possible to invest an amount as small as $100 into Uber in 2010 due to a ban that the SEC had implemented in 1933.  I highly recommend the video at the very bottom of this article. It provides details on how Uber became successful and how to find the next Uber.
With the SEC’s lifting of the crowdfunding ban today (May 16, 2016) every US citizen will be able to invest $100 or less into new companies for the first time since 1933. I highly recommend the video at the very bottom of this article. It provides details on how Uber became success and how to find the next Uber.
Prior to 1850 there was no such thing as an investor in the United States of America. Investing began because of the invention of the steam engine and the subsequent advent of railroads. Before the beginning of private investing, individuals merely deposited their money in banks. When banks refused to provide expansion capital to railroads, it became a motivating factor for pioneer merchants and residents to withdraw their money from the banks and become first-time investors in railroad stocks and bonds to encourage prosperity for their communities. The 6 minute 43 second video below covers how crowdfunding evolved in the 1840s, why the SEC banned it in 1933, and the future of crowdfunding because of the SEC’s lifting of the second and final ban on May 16, 2016.
There was no such thing as an investment bank or stock broker in the U.S. at the time individual investing began. Those whom the public trusted to make their first-ever investments and to ensure that their monies were being utilized to build the railroad were the community’s merchants and businessmen. One such merchant was Henry Lehman. He immigrated to Montgomery, Alabama in 1844 and set up a cotton exchange. The outcome of the success that Lehman and his brothers had in getting railroads financed was their founding of the Lehman Brothers investment bank in 1850, six years after Henry Lehman had immigrated to America. Goldman Sachs and the other investment banks, which were founded in the last half of the 1800s, all had deeply imbedded railroad roots. These new investment banks and their pioneer investors who financed the railroads went on to finance the companies that emerged to transform the economy from agricultural to industrial from the 1880s to the 1920s.
Major Inventions & Industrial CompaniesGenerating Dynasty Wealth Founded 1885-1919
Invention/Company
Co. and Year Founded
Market Cap 11/20/15
Telephone
AT&T (T), 1885
$207B
Electricity
General Electric (GE), 1889
$310B
Automobile
Ford Motor (F), 1903
$58B
Computer
IBM (IBM), 1911
$134B
Airplane
Boeing (BA), 1916
$100B
Radio
RCA, 1919
N/A acquired by GE
For a community, having railroad service was crucial to its very survival. Likewise, the laying of vast networks of railroad tracks from 1860 to 1890 is analogous to the advent of the Internet, which resulted in the majority of the world’s population gaining access to the World Wide Web and e-mail service in the late 1990s.
The railroad transformed the U.S. economy from being agrarian-based to having an industrial base. The railroads and then the Internet, which began the transformation of the U.S. economy from industrial to digital, are definitely the two greatest economic developments that have occurred within the U.S. during each of the last two centuries.
The birth of investing culminated with securities fraud becoming rampant in the 1920s, a period that became infamous as the “roaring twenties”. Growing fraud and corruption culminated both in the Stock Market Crash of 1929 and the ensuing nationwide Great Depression.
Four years after the Great Depression began, the United States Securities & Exchange Commission (SEC) was established. The SEC immediately implemented two laws prohibiting businesses (i) from advertising to raise capital, and (ii) from raising capital from individuals who were not accredited investors (possessing a minimum net worth of $1 million). The SEC also implemented rules and regulations requiring a business to utilize a licensed broker-dealer.
The complex network, or ecosystem, established by the SEC in 1933 and 1934, for the purpose of motivating investors to trust the securities markets, provided the capital for new inventions and businesses until 2010, when the Dodd Frank Act was passed and became law. Dodd Frank was a response to the crash of 2008, and it significantly increased the liability for the broker-dealers that financed new inventions and emerging companies. The Act also increased the SEC’s enforcement powers and increased its ability to prosecute broker-dealers. This resulted in many broker-dealers ceasing to finance new inventions and companies. The ecosystem that had been in place since 1933 was broken.
In 2012, the JOBS Act was passed. Under its provisions the SEC was mandated by the U.S. Congress to lift both of the bans that the SEC had put into place in 1933. In September of 2013, the SEC lifted the advertising ban. On May 16, 2016, the SEC lifted the ban prohibiting non-accredited individuals from investing in early-stage and start-up companies.
There were two caveats for the SEC’s lifting the ban. The first was that all entities wishing to raise capital from a crowd of non-accredited investors utilize a SEC approved funding platform. The second caveat was that a funding platform not promote or recommend any entity seeking funds over any other entity seeking funds. The limiting of a funding platform’s ability to promote or recommend a business needing funding created the need for Social Investing communities.
My October 20, 2014 “Crowdfunding Must Get Back to Its Roots” article explains why social investing communities would have to emerge for crowdfunding to be successful. Researching the history of investing and the ensuing in-depth studies of crowdfunding led to the founding of the Dynasty Wealth Investing Community in April of 2014. It also led to my conceiving of the Trophy Investing community.
Since Trophy will specialize in educating the crowd and will cull from all of the crowdfunding opportunities to recommend only the very best ones to community members I predict that it will become the Facebook of social or community investing. To become a member of the Trophy Investing community go to www.michaelmarkowsk.net and sign up for a FREE 30 day trial subscription to the Trophy Investing letter. The letter recommends the shares of micro-cap companies that have the potential to multiply in price within 5 years and the plan is to also recommend crowdfunding opportunities.
With the SEC’s lifting of its crowdfunding bans that had been in place since 1933 and the founding of Dynasty Wealth and the three other social investing communities mentioned in my October 2014 article, social or community investing is now back to its 1850 roots. The social investing communities will once again rise to be the primary financier of the companies that will drive the growth of the world economy.
Dynasty Wealth LLC, the “boutique” research firm that I founded evolved from research that I had conducted on the ongoing transformation from the industrial economy to the digital economy. My findings enabled me to conclude that the period from 2015 through 2020 would be the best ever for investors to generate dynasty wealth returns of 10- to 100-times from utilizing a truly diversified portfolio. The video entitled, “Digital disruptor companies have the potential to get $10 billion valuations quickly,” below provides details about how investing into a portfolio of digital disruptors enable investors to create dynasty wealth. It discusses digital disruptor UBER. A $10,000 investment into UBER in 2010 was valued for $105 million in 2015. I recently discovered a digital disruptor in the $593 billion U.S. grocery industry and my research recommendation covering it is available at www.michaelmarkowski.net.

Friday, April 29, 2016

​NIRP Crash Indicator back to Pre-Crash Level

Michael Markowski | 
Summary
Indicator had been upgraded to Yellow caution from Orange Pre-crash level on April 22
Yen Volatility is reliable leading Indicator for global equities markets
Yen has biggest one day gain versus dollar since 2010 on April 28, 2016
The appreciation of the yen versus all of the world's currencies on April 28, 2016, has resulted in the NIRP Crash Indicator going from a Pre-Crash Orange reading to a Cautionary Yellow reading. The NIRP indicator going from Yellow to Orange increases the probability of a market crash being imminent.
The ranking system for the NIRP Crash Indicator’s signals are freely available and posted at www.dynastywealth.com daily, as follows:

Red: Full-Crash; Orange: Pre-Crash; Yellow: Caution; Green: All-Clear.

Information about origin, development and reliability of the NIRP Crash Indicator is also available at the Dynasty Wealth website.
The signal change was the result of the yen making significant gains against all of its major peer currencies on April 28, 2016. The yen’s three percent appreciation versus the dollar represented its largest increase for a single day since 2010. The sudden and significant appreciation of the yen was caused by the Bank of Japan (BOJ) announcing upon the conclusion of its April 28, 2016 meeting that it would not be increasing the utilization of monetary stimulus.
Currency exchange rate volatility between the yen and all of its major peer currencies has escalated to levels previously unseen. As recently as Friday, April 22, 2016, the NIRP Crash Indicator went from Orange, where it had been firmly entrenched since April 1, 2016 to Yellow, after having spent the entire month of March at Cautionary Yellow. See "No April Fool's Joke: NIRP Crash Indicator Elevated to Pre-Crash Warning".
After the NIRP Crash Indicator experienced extended periods of stability with only one signal change from the beginning of March through the first 22 days of April, the volatility of the indicator has increased considerably. The signal went from Orange to Yellow on Friday April 22 and back to Orange within six days on Thursday April 28. For more about this see my recent  Seeking Alpha post.
Yen is a reliable leading indicator for global equities markets 
Based on the 40 years of experience that I have in predicting the movements of markets, stocks and currencies, etc., and the research that I have conducted on prior crashes, including the Crash of 2008, my conclusion is that when volatility increases significantly for the yen it becomes a leading crash indicator. The Japanese yen and the U.S. dollar are the world's two largest single country reserve currencies. For this reason, the yen is the best default safe-haven currency utilized by investors during any U.S. and global economic and market crises. When crises unfold, historically the U.S. dollar — by far the world's most liquid and largest safe-haven currency — is susceptible to dramatic declines until the storm has passed.
Savvy investors know that the U.S. is, unquestionably, considered the world's leading economy and markets. They know that upon a crash of the U.S. stock market the initial knee-jerk reaction would be a simultaneous crash of the U.S. dollar versus the world's second leading single-nation currency. The yen is currently the default-hedge currency. Even though the euro, arguably, ranks with the U.S. dollar as the world's top reserve currency, it is not the preferred hedge against the greenback. The euro is shared by 19 of the European Union's member countries that have wide-ranging social and economic policies, and political persuasions. For this reason, and also because Japan is considered to be one of the most fiscally conservative countries on the planet, the default currency is the yen. The U.S. dollar does not experience extended crashes versus the Swiss franc and the British pound during times of crises because each of the underlying countries has economies much smaller than Japan's.
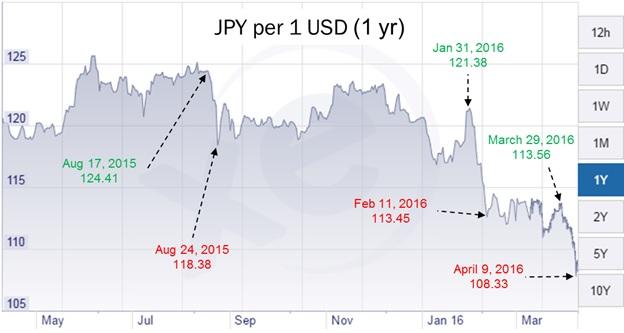
The currency and S&P 500 charts below depict the performance of the dollar yen exchange rate and its corresponding relationship to the performance of the S&P 500. The charts are for the 12 month and 10 year periods ended April 8, 2016. These charts were utilized for my conducting of the research and the charts were incorporated into my April 11, 2016, "Yen Volatility Is Leading Indicator For Market Sell-Offs" post. I highly recommend the viewing of the 7 minute 35 second video below "Yen Volatility Causes Market Crashes". It is a video interview of me by SCN’s Jane King about the subject matter of this specific report. I also explain all of the charts in this report during my interview.


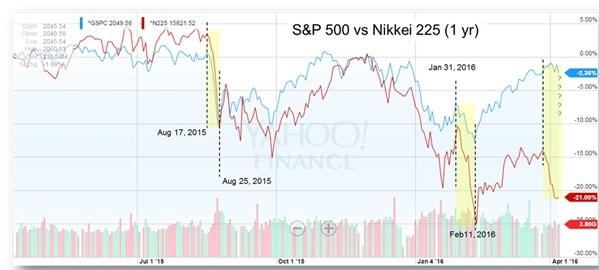
The trajectory of the extended downward spikes of the U.S. dollar versus the yen in August of 2015, and from January 31, 2016 to February 11, 2016 coincide with the downward spikes that were made by the S&P 500 and Nikkei 225 over the same periods. (The S&P 500 and Nikkei 225 chart appears under the chart immediately below.)
The "S&P 500 vs. Nikkei 225" chart above depicts the price performance correlations between the two major world stock indices for the global stock market crashes that occurred in August of 2015 and January/February of 2016. The above chart also depicts the divergence, or anomaly that has occurred between the Nikkei 225 and the S&P 500 since the beginning of April 2016. Given the prior price crash correlations of the world's two major stock indices, which coincide with the crashes of the U.S. dollar as compared to the yen, the probability is high that the divergence, or anomaly will prove to be temporary.
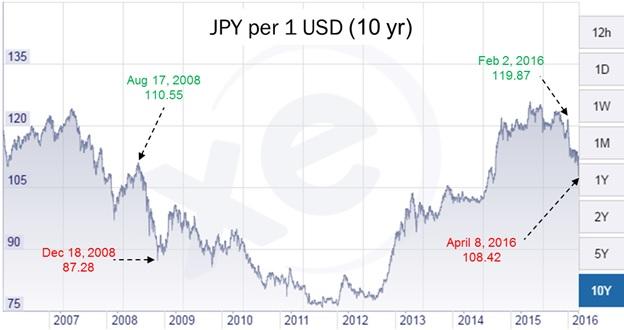
The 10-year U.S. dollar and Japanese yen chart below explains the relationship between the U.S. dollar and the yen during the crash of global markets that began in 2008 prior to Lehman's declaring bankruptcy, and lasted into early 2009. The chart depicts the U.S. dollar's declined by approximately 20% from 110.55 yen to 87.28 yen during the four-month period, which began in August of 2008 and ended in December of 2008. The chart depicts an approximate 10% decline in the U.S. dollar as compared to the Japanese yen from February to April of 2016. The chart also depicts that the U.S. dollar as of April 8, 2016 has not yet bottomed. Further, should the decline be equivalent to the decline of 2008 the U.S. dollar would fall below 100 yen.
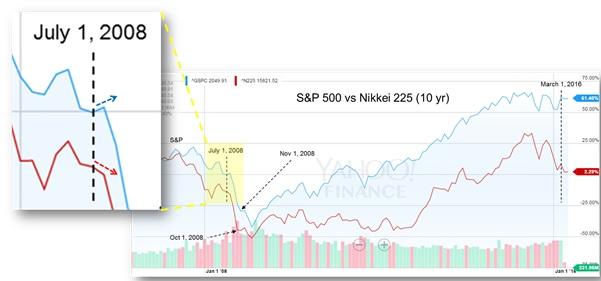
Below is a 10-year price-comparison chart for the S&P 500 and the Nikkei 225. At July 1, 2008 the charts for the Nikkei 225 and the S&P 500, which had been descending since May of 2008, diverged. The Nikkei 225 continued downward and the S&P went upward on July 1, 2008. The Nikkei continued on a downward spike trajectory until the index reached a base of support on October 1, 2008. The S&P 500 continued on its slightly upward trajectory until August 1, 2008. The S&P 500 than began a rapid descent, or spike, that resulted in its not finding its first base of support until November 1, 2008. Based on the 2008 charts, the Nikkei led the S&P 500 by a month during the crash of 2008. The chart also depicts the most recent divergence of the S&P 500 and Nikkei 225.
In Summary
Based on the body of research that I have conducted on spreading negative rates and the devastating effect that they are having on the global banking system, the probability is high that the major global stock indices (including the S&P 500) will begin a significant decline by 2018 at the latest. My April 11, 2016 article entitled, "Negative Rates Could Send S&P 500 To 925 If Not Eliminated," provides details about the potential mark down of the S&P 500 could likely be in stages. I highly recommend the viewing of my 9-minute 34-second video interview by SCN’s Jane King, entitled, "Why Negative Rates Could Send the S&P 500 to 925". In the video below I explain the math supporting the S&P 500’s decline to below 1000, and the reason it may be the only remedy to eliminate negative rates.

There are two reasons I am recommending the Short biased ETFs listed below: (i) the NIRP Crash Indicator going from Yellow to Orange has heightened the probability of a crash occurring; (ii) and, the three key central banks of the world — including the Bank of Japan (BOJ), European Central Bank (ECB), and the U.S. Federal Reserve — will not hold scheduled policy meetings until June of 2016. What that means is that the central banks cannot initiate any new monetary stimulus until June. The announcement by the BOJ on April 28, 2016 that it would not be adding any additional stimulus is bound to weigh on the markets until the next policy meetings are held by any of the key central banks. Since most of the appreciation of the markets since the crash of 2008 has been attributable to monetary and fiscal stimulus it is logical to conclude that the BOJ’s “do-nothing” decision will encourage profit taking during the month of May.
  • ProShares Short S&P 500 ETF (NYSEARCA:SH)
  • ProShares UltraPro Short Dow30 (NYSEARCA:SDOW)
  • ProShares UltraPro Short S&P500 (NYSEARCA:SPXU)
  • ProShares UltraPro Short QQQ (NASDAQ:SQQQ)
  • ProShares UltraPro Short Russell2000 (NYSEARCA:SRTY)
  • ProShares Short Dow 30 (NYSEARCA:DOG)
  • ProShares UltraPro S&P 500 (NYSEARCA:UPRO)
  • ProShares UltraShort Dow30 (NYSEARCA:DXD)
  • ProShares UltraShort 20+ Year Treasury (NYSEARCA:TBT)
  • ProShares UltraShort QQQ (NYSEARCA:QID)
  • ProShares UltraShort S&P 500 (NYSEARCA:SDS)
Finally, the BOJ’s April 28, 2016 announcement reduces the probability of the market spiking to new highs in the near term.  See “Bank of Japan Announcement Could Spike Market to New Highs”, April 27, 2016. 
Below please find active links to all of my articles pertaining to negative rates:
For the record, throughout my 40-year career I have always been a bull investor and have never invested as a bear. Even with my concerns about the macro-market, I am very bullish on several public and private micro-cap opportunities, which have the potential to multiply by 10- to 100-times by 2020. My reports covering some of my recommendations are FREELY available at my Dynasty Wealth Investing community’s website.